
Landsat TIRS#
Notebook showing a fast and efficient way to load Sentinel-2 L1C data into xarray
import glob
import os
import numpy as np

import pandas as pd
import geopandas as gpd
import xarray as xr
import rioxarray

import matplotlib.pyplot as plt
import matplotlib as mpl
import cartopy.crs as ccrs
from matplotlib.colors import ListedColormap

import GRSdriver
from GRSdriver import visual

opj = os.path.join

print(f'-GRSdriver: {GRSdriver.__version__}')


-GRSdriver: 1.0.5
Set the path of the images you want to load, here is a example for the former (v3) and current (v4) image formatting
image ='/data/satellite/landsat/LC09_L1TP_196030_20221120_20230321_02_T1'
l1c = GRSdriver.LandsatDriver(image,band_idx=[9,10])
l1c.INFO
| bandId | 9 | 10 |
|---|---|---|
| ESA | B08 | B09 |
| EOREADER | TIR_1 | TIR_2 |
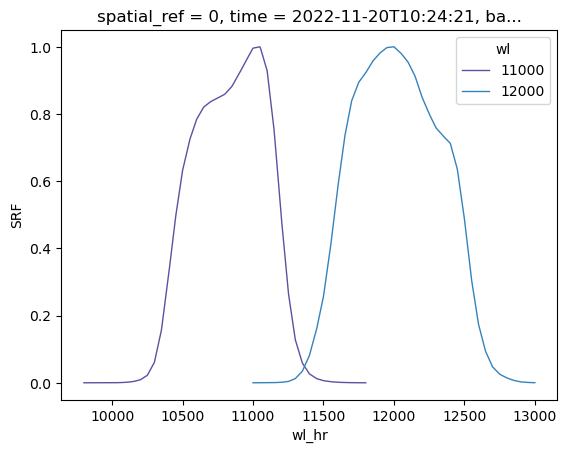
| Wavelength (nm) | 11000 | 12000 |
| Band width (nm) | 590 | 1010 |
| Resolution (m) | 100 | 100 |
l1c.load_mask()
l1c.load_product()
l1c.prod
<xarray.Dataset>
Dimensions:      (x: 7671, y: 7791, wl: 2, wl_hr: 2951)
Coordinates:
  * x            (x) float64 5.349e+05 5.349e+05 5.35e+05 ... 7.65e+05 7.65e+05
  * y            (y) float64 4.899e+06 4.899e+06 ... 4.666e+06 4.666e+06
    spatial_ref  int64 0
  * wl           (wl) object 11000 12000
  * wl_hr        (wl_hr) float64 400.0 401.0 402.0 ... 1.35e+04 1.35e+04
    time         datetime64[ns] 2022-11-20T10:24:21
    band         int64 1
Data variables:
    bands        (wl, y, x) float32 nan nan nan nan nan ... nan nan nan nan nan
    SRF          (wl, wl_hr) float64 ...
    wl_true      (wl) float64 1.084e+04 1.203e+04
    sza          (y, x) float32 nan nan nan nan nan nan ... nan nan nan nan nan
    vza          (y, x) float32 nan nan nan nan nan nan ... nan nan nan nan nan
    raa          (y, x) float32 nan nan nan nan nan nan ... nan nan nan nan nan
    flags_l1     (y, x) uint32 1 1 1 1 1 1 1 1 1 1 1 1 ... 1 1 1 1 1 1 1 1 1 1 1
Attributes: (12/17)
    long_name:              TIR_1 TIR_2
    constellation:          Landsat-9
    constellation_id:       L9
    product_path:           /data/satellite/landsat/LC09_L1TP_196030_20221120...
    product_name:           LC09_L1TP_196030_20221120_20230321_02_T1
    product_filename:       LC09_L1TP_196030_20221120_20230321_02_T1
    ...                     ...
    radiometry:             brightness temperature
    cloud_cover:            0.2
    wl_to_process:          [ 443  490  560  590  665  865 1610 2190]
    satellite:              Landsat-9
    solar_irradiance:       NA
solar_irradiance_unit: W/m²/µm#xr.open_dataset('/DATA/git/satellite_app/GRSdriver/GRSdriver/rsr/data/rsr_landsat_8_oli_tirs.nc').SRF.plot(x='wl_hr',hue='wl',lw=1)
import cycler

n = 12
color = plt.cm.Spectral_r(np.linspace(0, 1,n))
mpl.rcParams['axes.prop_cycle'] = cycler.cycler('color', color)

l1c.prod.SRF.plot(x='wl_hr',hue='wl',lw=1)
[<matplotlib.lines.Line2D at 0x7f3f20b8d430>,
 <matplotlib.lines.Line2D at 0x7f3f20b8d490>]
h = visual.ViewSpectral(l1c.prod.bands.assign_coords(time=l1c.datetime).expand_dims('time'),reproject=True)
h.visu()
import cartopy.crs as ccrs

epsg = l1c.extent.crs.to_epsg()
str_epsg = str(epsg)
zone = str_epsg[-2:]
is_south = str_epsg[2] == 7
proj = ccrs.UTM(zone, is_south)
coarsening=1
cmap = plt.cm.Spectral_r
fig = plt.figure(figsize=(20, 15))
ax = plt.subplot(1, 1, 1, projection=proj)
ax.set_extent(extent_val, proj)
l1c.prod.bands[:, ::coarsening, ::coarsening].isel(wl=0).plot.imshow( cmap=cmap,robust=True,subplot_kws=dict(projection=proj))
ax.set_title('')
---------------------------------------------------------------------------
NameError                                 Traceback (most recent call last)
Cell In[13], line 5
      3 fig = plt.figure(figsize=(20, 15))
      4 ax = plt.subplot(1, 1, 1, projection=proj)
----> 5 ax.set_extent(extent_val, proj)
      6 l1c.prod.bands[:, ::coarsening, ::coarsening].isel(wl=0).plot.imshow( cmap=cmap,robust=True,subplot_kws=dict(projection=proj))
      7 ax.set_title('')

NameError: name 'extent_val' is not defined
